Världens smartaste fotbollsanalyser
Det här är spelrekar och prognoser av yppersta klass. Vi räknar på samma underliggande data som proffsklubbarna bygger sina beslut på, men förädlar den med extremt välkalibrerade modeller som väger varje match på riktigt — sannolikheter, värdespel och färdiga kombinationer för 40 ligor, uppdaterat flera gånger om dagen. Och eftersom förtroende måste förtjänas redovisas varje tips öppet, träff som miss.
Modellen räknar — sannolikheter för varje utfall, resultatmatris och förväntade mål
Värdespel flaggas — när modellens sannolikhet överstiger vad oddset antyder
Öppet facit — varje tips fryses före avspark och rättas efter slutsignal
Närmaste prognoserna
Segunda División
 Real Sociedad B
Segunda División
 Las Palmas
Segunda División
 Sporting Gijón
Ligorna
Ishockey
Hockey på BetBuilders
Verktygen
Välj en match — simulera den eller bygg din egen betbuilder.
Veckans stormatch
Liverpool mot Manchester City
Modellens tips: 2 · Manchester City (48 %)
Läs hela analysenIdag · söndag 4 oktober
Hela facit →Dagens matcher
Dagens värdespel
Modellen ser inga tydliga övervärden just nu — värdespel dyker upp här när oddsen ger läge.
Senaste facit
- Åtvidaberg – FC Trollhättan1–11 47%
- Skövde AIK – Utsikten3–2rätt
- Jönköpings Södra – Eskilsminne0–11 58%
- Piteå – Karlstad Fotboll1–12 61%
Uppdateras löpande under dagen — värdespel räknas mot aktuella odds, facit rättas inom ett par timmar efter slutsignal.
Välkomsterbjudande hos våra spelbolag

18+ · Spela ansvarsfullt · stodlinjen.se · Annonslänk.
Topp 10 just nu
Färdiga betbuilders med mest övervärde
Spelbolagens färdigpaketerade bet builders, prissatta mot modellens resultatmatris. Skäligt odds är modellens pris utan marginal — listan visar kombosarna där erbjudet odds ligger mest över.
- 1Matchresultat - Hokkaido Consadole SapporoBåda lagen gör mål - JaTotalt antal mål - Över 3.5
Jubilo Iwata – Hokkaido Consadole Sapporo · J2 League · 10 oktober 2026
odds 14,27skäligt 10,00+43 %Lägg i kupongen hos Nordicbet - 2Matchresultat - NECBåda lagen gör mål - JaTotalt antal mål - Över 3.5
Ajax – NEC · Eredivisie · 10 oktober 2026
odds 17,63skäligt 13,06+35 %Lägg i kupongen hos Nordicbet - 3Matchresultat - JuventusBåda lagen gör mål - JaTotalt antal mål - Över 3.5
Cagliari – Juventus · Serie A · 11 oktober 2026
odds 6,00skäligt 4,48+34 %Lägg i kupongen hos Nordicbet - 4Matchresultat - Örgryte ISBåda lagen gör mål - JaTotalt antal mål - Över 3.5
Häcken – Örgryte · Allsvenskan · 11 oktober 2026 16:30
odds 16,74skäligt 13,24+26 %Lägg i kupongen hos Nordicbet - 5Matchresultat - BoltonBåda lagen gör mål - JaTotalt antal mål - Över 3.5
Bolton Wanderers – Stoke City · Championship · 10 oktober 2026
odds 8,90skäligt 7,06+26 %Lägg i kupongen hos Nordicbet - 6Matchresultat - PisaBåda lagen gör mål - JaTotalt antal mål - Över 3.5
Vicenza – Pisa · Serie B · 10 oktober 2026
odds 7,63skäligt 6,16+24 %Lägg i kupongen hos Nordicbet - 7Matchresultat - Deportivo A CoruñaBåda lagen gör mål - JaTotalt antal mål - Över 3.5
Real Sociedad – Deportivo La Coruña · La Liga · 11 oktober 2026
odds 16,08skäligt 13,01+24 %Lägg i kupongen hos Nordicbet - 8Matchresultat - AscoliBåda lagen gör mål - JaTotalt antal mål - Över 3.5
Südtirol – Ascoli · Serie B · 10 oktober 2026
odds 9,98skäligt 8,21+22 %Lägg i kupongen hos Nordicbet - 9Matchresultat - Amed SFKBåda lagen gör mål - JaTotalt antal mål - Över 3.5
Gençlerbirliği – Amedspor · Süper Lig · 10 oktober 2026
odds 7,26skäligt 6,18+17 %Lägg i kupongen hos Nordicbet - 10Matchresultat - LyngbyBåda lagen gör mål - JaTotalt antal mål - Över 3.5
Brøndby – Lyngby · Danish Superliga · 11 oktober 2026
odds 12,34skäligt 10,61+16 %Lägg i kupongen hos Nordicbet
18+ · Spela ansvarsfullt · stodlinjen.se · Annonslänkar
Se alla betbuildersDitt eget bygge
Ställ din hypotes mot marknaden
Bygg vilken kombination du vill på en match — resultat, mållinjer, korrekt resultat, målskyttar, assist, kort, hörnor — och få modellens ärliga pris direkt ur resultatmatrisen. Sedan kommer det som ingen annan ger dig: ett klick söker av spelbolagen efter exakt din kupong och visar vad den kostar hos dem just nu.
Skillnaden är ofta brutal. En trebensare vi testade betalade 4,61 hos bolaget medan de tre oddsen multiplicerade med varandra antyder 9,57 — benen hänger ihop, och det syns bara om någon räknar på det. Det är hela poängen: här kan du pröva din egen idé mot marknadens pris innan du satsar en krona.
Segunda División · 4 oktober 2026
Real Sociedad B – Granada
Bygg och jämför
Segunda División · 4 oktober 2026
Las Palmas – Real Valladolid
Bygg och jämför
Segunda División · 4 oktober 2026
Sporting Gijón – Celta Fortuna
Bygg och jämför
Ny här? Hjälpsidan går igenom allt steg för steg, och så funkar verktyget förklarar hur priset räknas fram. Alla matcher med prognos hittar du under Matcher, och bolagens färdiga betbuilders prissätter vi mot modellen på samma sätt.
Spela hos våra partners

Se ComeOns villkor
Hämta bonus
Se Hajpers villkor
Hämta bonus
Se Snabbares villkor
Hämta bonus18+ · Spela ansvarsfullt · stodlinjen.se · Annonslänkar
Modellen tippar · marknaden följer efter
Marknaden håller med
Matcher där vår modell har en klar favorit — och oddset sedan öppning tydligt rört sig åt samma håll. När marknaden bekräftar modellen är det värt att titta närmare.
3. Liga
10 oktober 2026Jahn Regensburg – SV Havelse
Modellen: Jahn Regensburg 58 %
Oddset:1,72 → 1,588 %
Hela analysen
League One
10 oktober 2026 16:00Mansfield Town – Bromley
Modellen: Mansfield Town 58 %
Oddset:1,77 → 1,676 %
Hela analysen
League Two
10 oktober 2026 16:00Crawley Town – Chesterfield
Modellen: Chesterfield 56 %
Oddset:1,73 → 1,645 %
Hela analysen
Oddsrörelse sedan öppning hos referensbolaget, uppdateras löpande. Rörelse är inte en garanti — men medvind är medvind. Alla ligor med prognoser
Modellen mot marknaden
Så har tipsen gått
Varje tips rättas mot slutresultatet och mot stängningsoddset — rått och osminkat. Siffrorna nedan är ett rullande fönster, hela historiken ligger i arkivet.
Träffprocent · senaste 50
48 %
24 rätt av 50 rättade tips
Flat insats mot stängningsodds
+0 %
50 tips med prissatt utgång
Skrällar prickade · odds ≥ 3,00
0
Modelldrivna prognoser · 40 ligor
Prognoser, speltips & öppet facit
Samma matchmodell som proffsklubbarna använder räknar fram sannolikheter, resultatmatriser och värdespel för varje match. Tipsen fryses före avspark och rättas öppet — träff som miss.
Skotska ligan
6 matcher · lör 10 okt.
Danska Superligan
6 matcher · fre 9 okt.
Schweiziska ligan
6 matcher · lör 10 okt.
Serbiska ligan
7 matcher · lör 10 okt.
Slovakiska ligan
8 matcher · lör 10 okt.
Mexikanska ligan
9 matcher · lör 10 okt.
La Liga
10 matcher · fre 9 okt.
Segunda División
17 matcher · sön 4 okt.
Premier League
10 matcher · lör 10 okt.
Bundesliga
9 matcher · fre 9 okt.
Serie A
10 matcher · lör 10 okt.
Serie B
10 matcher · fre 9 okt.
Ligue 1
9 matcher · fre 9 okt.
Championship
12 matcher · fre 9 okt.
League One
12 matcher · lör 10 okt.
League Two
12 matcher · lör 10 okt.
Allsvenskan
6 matcher · fre 9 okt.
Superettan
7 matcher · lör 10 okt.
Ettan
18 matcher · sön 4 okt.
Eredivisie
9 matcher · fre 9 okt.
Eerste Divisie
11 matcher · sön 4 okt.
Belgiska ligan
9 matcher · fre 9 okt.
Portugisiska ligan
9 matcher · fre 9 okt.
Liga Portugal 2
9 matcher · fre 9 okt.
2. Bundesliga
9 matcher · fre 9 okt.
3. Liga
10 matcher · fre 9 okt.
Ligue 2
9 matcher · fre 9 okt.
Süper Lig
8 matcher · fre 9 okt.
Turkiska 1. Lig
10 matcher · fre 9 okt.
J1 League
10 matcher · fre 9 okt.
J2 League
15 matcher · sön 4 okt.
Grekiska Super League
7 matcher · lör 10 okt.
Österrikiska Bundesliga
6 matcher · lör 10 okt.
Kroatiska HNL
5 matcher · fre 9 okt.
Tjeckiska ligan
8 matcher · fre 9 okt.
Ekstraklasa
9 matcher · fre 9 okt.
Eliteserien
8 matcher · fre 9 okt.
Champions League
mellan omgångar
Europa League
mellan omgångar
Conference League
mellan omgångar
Öppet facit
Varje tips rättas efter slutsignal — träffprocent och avkastning, match för match.
2548 rättade tips · 48 % rätt tecken
Fantomens Elitficka
Strategin som bara spelar favoriter med övervärde i världens topligor. Följ facit — eller prenumerera på tipsen.
Se strategin
Labbet
Simulera valfri match — byt spelare, stil och formation — och få tre färdiga kombispel räknade ur resultatmatrisen.
Öppna simulatorn
Analyser & studier
Alla artiklar →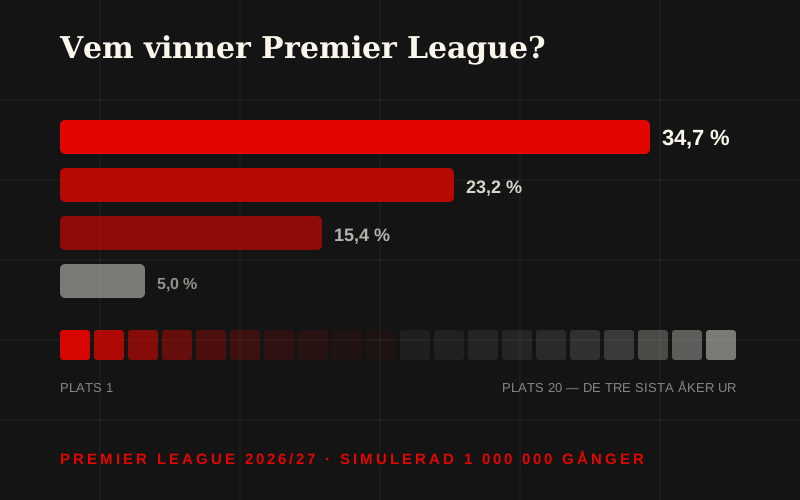 Premier League
2026-08-18
Premier League 2026/27 — simulerad en miljon gånger
Arsenal vinner 34,7 % av en miljon simulerade säsonger — City 23,2, Liverpool 15,4. Nykomlingen Coventry slutar sjua och Hull är största nedflyttningskandidat. Hela tabellen, plats för plats.



Statistik-godis
Siffror som sticker ut
Leken
Slå modellen
Tippa tecken på tre kommande matcher. Vi rättar dig och modellen när matcherna är spelade — facit väntar här nästa gång du tittar in. Allt sparas bara i din webbläsare.
Med modellprognos
Segunda División
 Castellon
Segunda División
 Girona
Eerste Divisie
 VVV-Venlo





Vad är BetBuilders?
BetBuilders är en svensk plattform som samlar världens smartaste fotbollsanalyser på ett ställe. Vi gräver igenom data, statistik och odds för att plocka ut de mest intressanta spelmöjligheterna åt dig — varje dag, från alla stora europeiska ligor. Oavsett om du är nybörjare eller van spelare hittar du värde här.
Utöver matchanalyser erbjuder vi även Sveriges mest avancerade reduceringsverktyg för Stryktipset och Europatipset — helt gratis. Bygg smarta system, reducera intelligent och exportera direkt till Svenska Spel.
Så fungerar våra analyser
Våra modeller analyserar tusentals matcher och jämför med aktuella odds för att hitta spel som sticker ut. Istället för att du ska behöva grotta ner dig i statistik och oddsjämförelser gör vi det tunga jobbet — och presenterar resultaten i lättlästa analyser med tydliga värdetal.
Kärnan i BetBuilders är att identifiera matcher där oddsen är generösa i förhållande till vad datan visar. Det är den typen av spel vi lyfter fram — inte alla matcher, utan de smartaste. Varje dag kurerar vi de bästa möjligheterna så att du alltid vet var värdet finns just nu.
Ligor vi analyserar
Vi täcker matcher från Premier League, La Liga, Bundesliga, Serie A, Ligue 1, Champions League, Europa League, Championship, Allsvenskan och Superettan. Alla analyser uppdateras dagligen med senaste data.
Tips för smartare betting
Nyckeln till smart betting är att fokusera på värde snarare än att försöka förutsäga varje match rätt. BetBuilders visar vilka matcher som har generösa odds just nu — spela konsekvent på dessa och låt matematiken jobba för dig över tid.
Hantera din bankroll klokt. Satsa aldrig mer än du har råd att förlora och undvik att jaga förluster. En disciplinerad strategi baserad på data ger bättre resultat än magkänsla och impulsiva spel.
Vanliga frågor
Vad är BetBuilders?
Vilka ligor täcker ni?
Är analyserna gratis?
Hur fungerar era analyser?
Kan jag bygga en egen betbuilder och se vad den kostar hos spelbolagen?
Hur hittar jag de smartaste spelen?
Bli en vassare spelare
Fler guider →Strategi, spelpsykologi och bankroll — de tidlösa greppen bakom långsiktigt spelande. Inga dagstips, bara hantverket.